This post is a quick record of voltage drift / variations I noticed during recent experiments with using a MOSFET as a voltage-controlled resistor, where the MOSFET's Gate-Source voltage was driven by the Ruideng RD6006(W) DC-DC power supply.
I'll do another post on the MOSFET-as-a-resistor topic, but for now let's focus on the observation regarding the power supply behavior.
Note: I'm no expert in power supplies or electronics in general, and I have no access to a proper lab-quality millivolt-resolution supply or a stabilized/buffered voltage reference. I don't work with noise-sensitive circuits, so all I have is a few Ruidengs as they're overall a great bang for the buck, and do the job just fine 99.9% of the time. I suspect the observed behavior is perfectly normal in entry-level supplies, and the device is still well within its spec. This is not a complaint about the RD6006, just something interesting I found during an experiment.
Background
The experiment involved a logic-level MOSFET, model FQP30N06L from ON Semiconductor (datasheet). I'm using the MOSFET as a voltage-controlled resistor in order to dynamically adjust the discharge current of a NiMH or Li-Ion cell. In order to do that, the MOSFET's RDS (resistance between Drain and Source) must be accurately controlled within ~1 Ohm to ~40 Ohm range to fit my particular use case.
The trick is that the RDS curve of a MOSFET is far from linear. The MOSFET has:
- The "Ohmic region", where there's a linear relationship between RDS and Gate-Source voltage.
- The "saturation region" a.k.a. "on-region", where RDS sits flat at its minimum value and no longer decreases with more Gate voltage.
- The "knee", where the resistance curve changes sharply between the two regions.
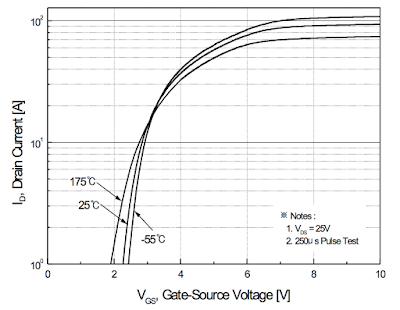
In a datasheet, the relationship between Gate-Source voltage and Drain-Source resistance is typically shown as a Current/Voltage curve i.e. the amount of current allowed between Drain and Source depending on Gate-Source voltage.
Here's the curve for the MOSFET in question:
In my use case, the challenge is that I'm operating deep within the "knee" area, which means that tiny changes in Gate-Source voltage cause very large changes in resistance. My requirement is to control RDS accurately or otherwise the cell discharge current will be all over the place. Therefore, I must also control Gate-Source voltage very accurately i.e. ideally down to a millivolt.
In any case, I decided to hook the MOSFET up to the power supply in order to get a rough idea of how accurate my voltage needs to be in order to control RDS within the desired range i.e. what kind of resistance change should I expect for a given change in Gate-Source voltage.
Issue and troubleshooting
As I connected to the RD6006 power supply and experimented with various voltage levels, I noticed that the MOSFET resistance drifted quite substantially and wouldn't stabilize.
At this point I had two set of test leads attached to the circuit:
- A set of 4-wire Kelvin clips attached to a bench-top multimeter, to measure RDS.
- A pair of leads to externally verify the Gate-Source voltage, attached to a handheld multimeter.
No matter the voltage, the measured RDS value seemed to be in constant flux, and I couldn't get it to stabilize. At first I thought it might be due to MOSFET's temperature coefficient, but I managed to quickly disprove it with a series of simple touch/cool tests.
The breakthrough came when I enabled the trend chart view for resistance measurements instead of continuing to stare at a number. The chart looked like this:
This is already telling a story, but why would resistance change so wildly [1] presumably without a change in Gate voltage [2]? Answer from the future: because I'm within the "knee" area [1] and the poor 3 1/2 digit handheld DMM didn't do a great job visualizing millivolt-level voltage drift [2].
I connected the voltage sensing leads to a different, more accurate DDM, and enabled trend chart view as well:
Everything was clear now. The MOSFET is behaving as it should, it's just that the power supply voltage wasn't stable enough for what I was trying to do.
I then repeated the voltage measurements:
- Without the MOSFET, but with the multimeter attached directly to the power supply.
- With or without load.
- Using various output voltages.
- Using different DC input supplies for the RD6006, ranging from 9V through 12V to 19V.
- Using a different RD6006 altogether (I have multiple).
Each time the result was pretty much the same, and I observed ~3 mV of drift over a ~second period. This is well within the spec for the supply, but it's also plenty enough to throw off the MOSFET. It just seems to be how these supplies work.
Even better, the fluctuation is also present with the power supply supply output turned off, although in this case the amplitude was much smaller (~3 uV):
I made sure to check that the effect wasn't caused from the multimeter itself. With nothing connected to the meter, it only showed some expected random fluctuations, but did not exhibit the sawtooth pattern:
Again, I'm no expert in this area so I might as well be discovering the obvious about how power supplies work, but it was still a fun troubleshooting exercise.
Thanks for reading!


No comments:
Post a Comment